
WHY INCUMBENT DATA IN SALARY SURVEYS IS MISLEADING
For many years, employers have used salary surveys to provide market references to manage compensation in their organization and to “price jobs” in the market. Conventional wisdom suggests a high-quality, reliable survey has the following characteristics:
- The largest possible group of participants
- The greatest number of specific jobs
- The highest number of incumbents reported
- Survey statistics based on incumbent-weighted averages
In short, bigger is better.
As is often the case, we believe that the conventional wisdom is wrong!
Incumbent-based data is not job-based – it’s personal!
Think about it.
- Salary ranges represent the range of pay an employer is prepared to offer for position with the same level of contribution to their organization (e.g., the same equivalent worth).
- All incumbents are placed within the same internal, generic range (employers do not usually have separate salary scales for each occupational group or function).
- Individual salary levels are not determined by any job factor! Incumbent salaries are based on personal characteristics such as qualifications, skills, experience and performance, and organizational constraints such as internal policies and guidelines, and internal equity.
There are no job-based factors used to determine placement in the range. It is easy to conclude using actual incumbent salaries instead of salary ranges is — at best – misleading, if not entirely invalid. But don’t take our word for it. Let’s put it to a test.
Salary Range Data is Highly Correlated to Incumbent Values
Birches Group did an analysis of actual incumbent data values and the corresponding salary range values for BG-10 level Senior Working Professional roles in Jamaica. The dataset included positions from seven different job families. Twenty-nine employers reported data at this level.
To start the analysis, we examined each discrete position reported by each employer. In the chart below, the positions are color-coded by occupation (job family), and each employer is represented by a vertical array of dots. The chart shows all observations, not a specific percentile.

You can see there is a wide variety of values, both within each employer and across different ones.
Next, we examined the salary ranges for these employers, and determined how the incumbent salaries fell into each employers’ salary range. The chart below shows the ranges.
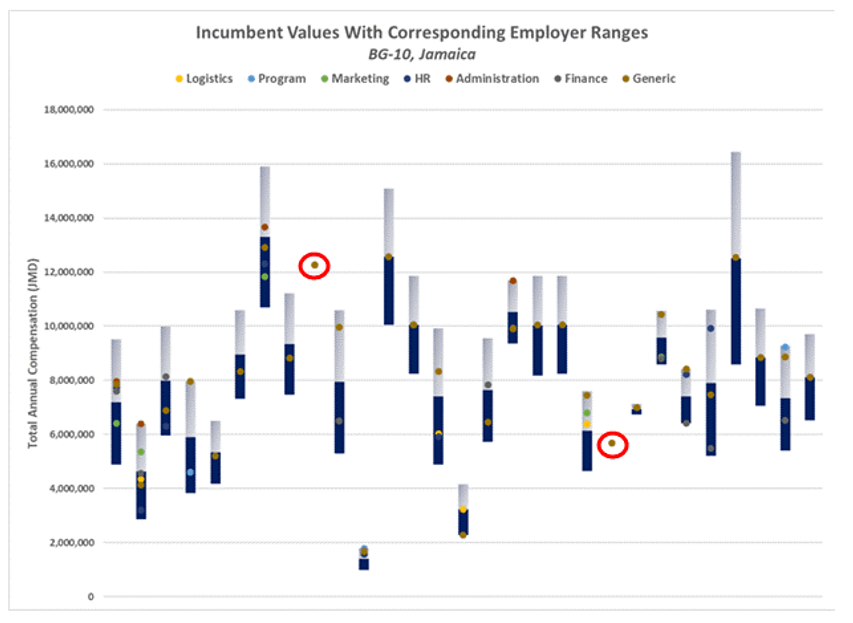
It’s clear that except for two employers with no formal range defined (the two single dots in the chart circled in red), the rest all have salary ranges defined. Some of the incumbent values are distributed across the ranges, while some are more clustered, but they are all within the range! You will also notice that the range spans (the “distance” from minimum to maximum) varies quite a bit – some employers use narrow ranges, others wider ranges, depending on their unique circumstances and requirements.
A common benchmark that many clients use is the 50th percentile or median of the market. While we could debate the definition of “the market” (and we will in another post), it is possible to measure the median of the salary ranges in a market.
For BG-10 in Jamaica, the subject of this analysis, the 50th percentile salary range is J$ 6,273,150 to J$ 9,576,152. We calculated these numbers by simply separately calculating the median of all the reported minimum values, and all the reported maximum values. The next chart shows this median range added to the incumbent chart.

Now you can see which incumbent data points are within the 50th percentile range in the market. It’s important to realize that a percentile value in a salary survey should never be a single number; it should always be a salary range. If you rely only on incumbent data points when using surveys, you are missing out on what is really happening in the market.
Combining the two prior charts yields the next one, which shows the employer salary ranges against the 50th percentile (shaded blue horizontal bars):

You can observe that just 6 employers (about 21% of the sample) have ranges that are totally outside of the 50th percentile range of the market. Or stated another way – nearly 80% of employers have a salary range that intersects with the market median range.
We also examined the data by occupation, looking at the mean range for each occupation versus the market.

In the above chart, you can see, aside from Logistics and Program, which were matched by fewer than 8 employers and not truly representative, the rest of the occupational data ranges fall well within the overall 50th percentile. In other words, the occupation or job family doesn’t impact the going rate for a job very much at all, and it would be very easy to just use the overall data, without any occupational designations, as the basis to determine your market position.
Think about it.
You go crazy trying to match multiple benchmark jobs in surveys. Then you take that data and apply a secret formula (perhaps weighted averages by incumbent count, for example) to arrive at a “going rate” for your midpoint. But the data you are combining isn’t really that different; our data shows you could just take the range we report and go from there. Much easier.
A New Vision for Salary Survey Data
Birches Group believes that salary survey data should be job-based, not personal. Salary ranges represent for an employer the potential range of salary which the organization is willing to pay for a job at a specific grade level in the organization. In other words, the range represents the value the organization attaches to all jobs at that grade level, which are deemed to have equivalent worth because they have been evaluated to the same grade. Salary ranges, not incumbent data, represent job-based values which are appropriate for benchmarking salaries.
By comparing salary ranges instead of incumbent data, employers avoid using personal data, which is volatile and introduces a level of false precision which is misleading when specific jobs or occupations are compared to each other.
Introducing Community™ Market
Community™ Market is the new name for the Birches Group salary and benefits survey. The survey format has been streamlined and simplified and includes several new features, including an easy and convenient way to assess your market position at a glance. Another important change is the way job information will be captured. We will no longer show separate market values for each benchmark job. Instead, we will show data aggregated for all jobs at the same Birches Group level. We will still identify which jobs are in which grade, but as we’ve demonstrated, the occupational differences reported in surveys (including ours) are resulting from personal data, not job-based information, and are not appropriate for benchmarking.
Community™ Market is part of the Birches Group Community™ platform for integrated HR management. The platform includes modules for job evaluation (Community™ Jobs), skills assessment (Community™ Skills) and performance management (Community™ Performance) in addition to market surveys. The job levels established using our Community™ Jobs methodology are used to provide job levels in our surveys, and to assess skills and performance against standards that reflect the same job levels. It’s the first integrated approach to human resources management.
Learn More
Contact us to learn more about the changes in our survey methodology, or to explore how the Community™ platform can be useful for your organization.
Want to know if your existing compensation practices have the elements of a good compensation program or if there are areas that could use some improvement? Take our quick Compensation Program Assessment Quiz to know your score!

Warren joined Birches Group in New York as a partner in 2007, following a long career in Compensation and Benefits at Colgate-Palmolive. He held the position of Director, International Compensation for 10 years immediately prior to joining Birches Group. Warren has broad experience working across the globe with clients on local national and expatriate compensation projects. He leads our Business Development and Client Services teams and manages our strategic partnerships around the world. Warren previously held leadership positions for the Expatriate Management Committee of the National Foreign Trade Council and was president of the Latin America Compensation and Benefits Forum.
